SQLbits 2024 - The Best Bits

For the third year in a row I attended SQLbits - the largest expert led data conference in Europe. This time the journey took me from Scotland to the exhibition centre in Farnborough in Hampshire, South West of London. Farnborough has a long association with aviation, and hosts a world renowned international air show every year.
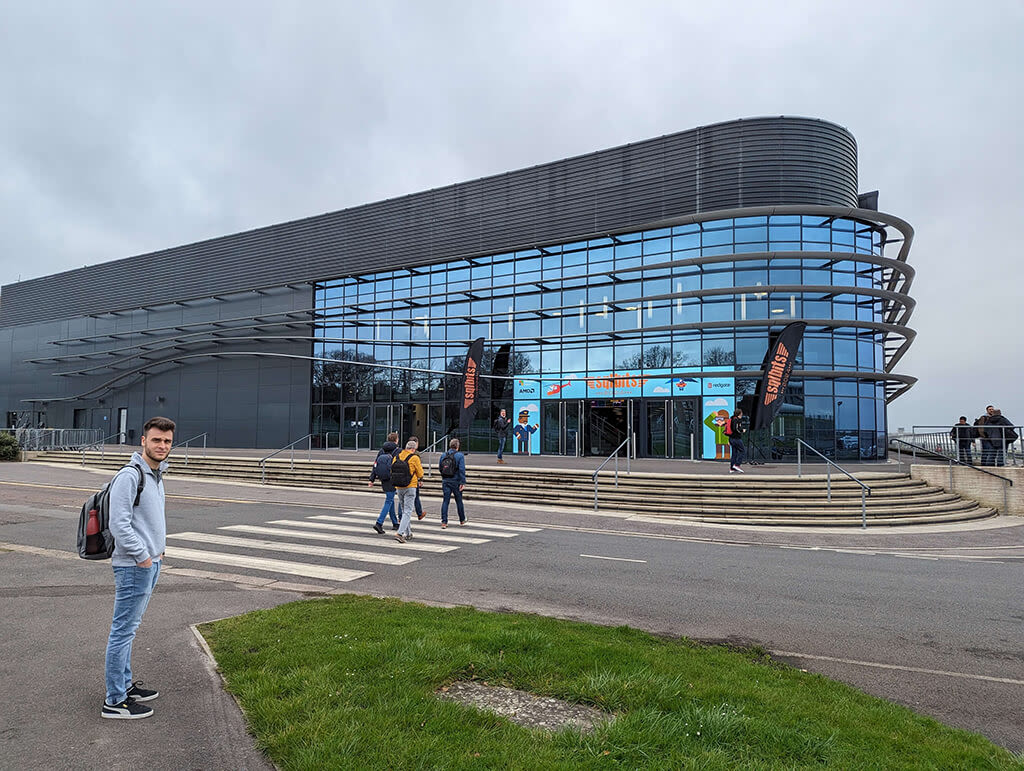
SQLbits took advantage of the massive exhibition space which is on offer at Farnborough. As you would expect, the theme for the conference this year was aviation, and it was embraced throughout the conference by the vendors, in the various sessions and in the after party on the Friday evening. For example, music from the Top Gun movie was on a loop in the background in the main exhibition space.
On first entering the conference they had simulated the departure gate and security experience at an airport, helpers were dressed as pilots and flight attendants!
Instead of rooms, there were 14 "gates" to which attendees were directed to attend the different sessions. A large "departures" board live streamed video from all of the sessions into the main exhibition space. From the comfort of a bean bag in the main exhibition space, you could browse and then join an audio feed for any session.

There was a real buzz in the main exhibition space and a few new exhibitors to meet too! This felt like another step up in scale from SQLbits last year. Microsoft had a large central stand manned by product and CAT team members for SQL Server, Microsoft Fabric and Power BI. It was nice to meet them face to face, and to pick up some Microsoft branded swag too!
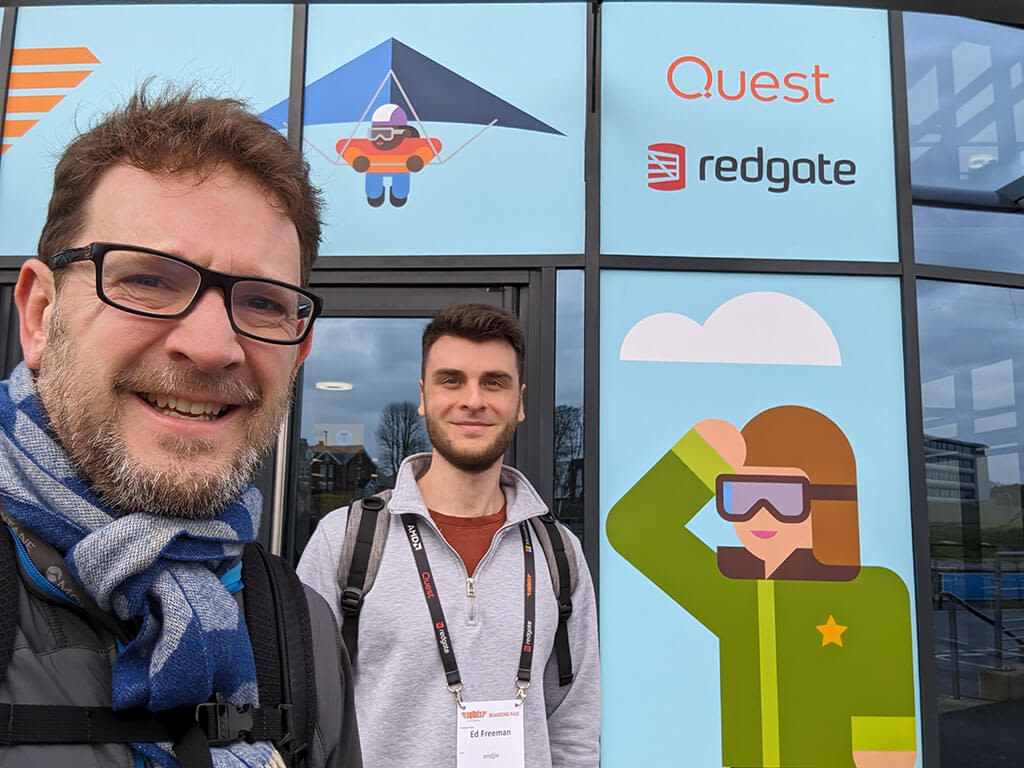
Ed and I arrived at the conference on Tuesday to run a training day session "DataOps: How to Deliver Data Faster and Better with Microsoft Cloud".

Our fellow endjineers joined us on Thursday and Friday. We used the conference as an opportunity to get the whole organisation together for a meet up. It was great to see colleagues face to face! We competed as a team at the pub quiz on Thursday night which was very well run and attended. The sports round let us down.

The rest of this blog captures the highlights from the sessions I attended.
Flying High Amongst the Clouds with Fabric Warehouses
This session was run by the dynamic duo Andy Cutler and Brian Bønk.
They provided an excellent insight into how Microsoft Fabric Warehouse adopts a modern cloud native architecture, enabled by separation of storage and compute.
Queries are processed and executed by the Polaris engine, using shared cloud resources. You give up some of the control you may be used to in traditional warehouses but gain scalability and a lower total cost of ownership.
The storage layer is provided by One Lake where table metadata is synchronised across different compute engines. Data is stored in Delta format - which is parquet files augmented by a transaction log. This enables transactional consistency, time travel, ACID transactions, equivalent to the way in which MDF and LDF files work in SQL Server.
By default, Fabric presents the Delta files to you in tabular format, but it is possible to browse the underlying parquet files JSON transaction files using tools such as Storage Explorer (which we love!).
When using the Lakehouse engine (Spark) rather than the Warehouse engine (Polaris) you have more granular control over things like size of parquet files and partitions. This level of tuning and optimisation is automated by the Warehouse engine behind the scenes.
We were given a demo of how the underlying parquet files evolve given different operations. Parquet files are immutable, so inserts and updates create new parquet files. To optimise performance, deletes are typically stored in the JSON transaction files as a "deletion vector". There was a discussion about a "tipping point" being applied based on the number of rows that were being deleted.
The "T-SQL surface area" in Fabric does not cover all of the T-SQL commands that are available in a traditional SQL Server based warehouse - the most significant features that are not currently supported are ALTER TABLE, identity columns, TRUNCATE, CREATE ROLE/USER and recursive queries.
We also saw a demo of optimistic concurrency in action and how the Fabric Warehouse handles the situation when two processes writing to a table collide. This not a common issue in a warehouse as a single analytics pipeline tends to be writing to a table in the lake.
We also heard how use of Fabric Warehouse is billed, using bursting and smoothing algorithms. In a nutshell, bursting allows you to consume beyond your capacity for short periods of time. Smoothing is then the process to recover the cost during quiet periods.
In terms of database operations, disaster recovery is built in, supporting an RPO of 7 days. This 7 day window is governed largely by the "vacuuming" process that runs automatically to maintain Delta files.
Query insights tables allow you to analyse the queries that are being run over the warehouse.
Fabric Warehouse has also implemented table cloning (which is implemented as a "shallow" clone at meta data level), which is useful for backups and recovery by enabling a snapshot to be taken at specific point in time.
CREATE TABLE AS CLONE OF
In terms of DataOps (we think of this as simply DevOps for data projects), Azure Data Studio enables source control of warehouses. With power comes great responsibility, we were advised to use with caution as some operations can result in data being deleted! Security can be applied at different levels of granularity: workspace, warehouse and object levels.
When it comes to connecting Power BI to your Fabric Warehouse, Direct Lake was described as "amazing, performant". One word of caution was that if you connect your Power BI report to views in a Fabric Warehouse it will revert to Direct Query.
Overall it was insightful to see how the features available in Delta are influencing the behaviour of the Fabric Warehouse service. It was also great to hear Andy and Brian speaking about all that is new in Fabric Warehouse with such enthusiasm!
Advanced dimensional modelling
I couldn't get into this session by Arthur Graus it was packed out.
However, I did manage to listen on the live feed. I have to say that the audio-visual and live streaming technology used by SQLbits is fantastic, with professionals in each room to operate the technology and make sure it all runs smoothly. It means that you never have to miss a session and opens up the conference to those who want to join remotely.
Arthur's session was entertaining and informative. I agreed wholeheartedly that the primary purpose of dimensional model is to make Power BI reports "user friendly". I recently published a blog "Star Schemas are fundamental to unleashing value from data in Microsoft Fabric" that says the same thing!
Arthur described the concepts of fact and dimension tables and the differences between star schemas and snowflake schemas. Bringing the concepts to life with real world examples.
As an experienced Power BI professional, Arthur was able to provide some solid advice based on his experiences. For example, if you add "many to many" relationships to your Power BI semantic model, you are likely to suffer from poor performance and create non-intuitive behaviour in reports when filtering. I also liked his statement: "the date dimension is a super power for business intelligence".
He set challenges for the audience to discuss in pairs and solve. I liked this approach as it reinforced the purpose of these "in person" events - to get people collaborating and to allow us to meet other people that we would not other have had the opportunity to meet!
Microsoft Fabric Power BI Direct Lake Deep Dive
Phil Seamark delivered this session in running shoes, shorts and T shirt so that he could dash off to participate in the SQLbits 5K run immediately after the session.
Phil compared the three options that are available to connect Power BI to tables in the Fabric Lakehouse: Import, DirectQuery and the new Direct Lake option.
The comparison was based on the following considerations:
- Load time - how long does it take to get data into the Power BI semantic model when it is refreshed? As we know Import Mode it can result in significant refresh times for large models. But the benefit is reports tend to be more responsive for end users.
- Model size - what is the size of the resulting semantic model? Again Direct Model can create large models that in some cases hit limits on the Power BI service and therefore preventing reports from being published.
- Query performance - what is the query speed when interacting with the model? This is where DirectQuery can result in slow response in reports, because queries have to be routed back on the source SQL server engine rather than being executed in the Analysis Services Vertipaq engine.
Direct Lake has the capability to perform well across all three of these dimensions. To achieve this, it adopts the following innovations:
- No data is held in memory until it is "paged" into the semantic model on demand based on end user interactions with the report.
- Tables can have resident versus non-resident columns (only the columns that are being used in queries are resident).
- To minimise data being held in memory, column data can be "evicted" due to inactivity (a "temperature" used to drive this).
- "Framing" is adopted to ensure consistency of data in Power BI reports, by ensuring that tables do not get out of sync.
Direct Lake achieves this by:
- Leveraging the Delta format that is used to store data in the Fabric OneLake.
- Taking advantage of the columnar storage approach that is used by Delta and the fact that this is closely aligned to the way that the Analysis Services Vertipaq stores data.
- Applying Microsoft's proprietary V-Order technology when writing Delta parquet files to the Fabric Lakehouse. This reduces file size and speeds up read times significantly.
Notes:
- "Microsoft Proprietary" does not mean the parquet files are now only compatible with Microsoft tooling. You can still open these files with any parquet parser.
- I also learned that V-Order is the same compression algorithm that is used in analysis services (it's been around since 2009).
Phil ran a series of demos that benchmarked DirectLake over large "billion row" tables, using DAX Studio to take a deep dive into the underlying mechanics. It was impressive to see how well this new technology works for the majority of use cases.
Phil also made us aware of some of the limitations that currently exist with Direct Lake:
- No support for calculated columns / tables - this tends not to be an issue as this can typically be pushed upstream into Fabric Data Factory Pipelines or Dataflows, or Notebooks.
- No support for composite models.
- Direct Lake can only be used with tables, does not work with views in a Fabric Warehouse. If you connect it to a view, it will fall back to DirectQuery.
- Security can only be applied in the semantic model layer.
- Not all data types supported by Delta format.
- Under certain conditions, DirectLake falls back to SQL Server end point and DirectQuery.
Phil advised to us to "watch this space" for new features.
He ended his talk with a word of caution. Will reports always run faster with Direct Lake? Not necessarily. If your report is running slow in Import mode, it is likely to run slow in Direct Lake. Under this scenario you are likely to have more fundamental issues with the design of your semantic model.
Data Mesh vs Data Fabric - in Microsoft Fabric
Despite the preceding keynote session running over by 10 minutes, Marthe Moengen (in her trademark pink jacket) remained cool and calm during her own session.
She provided a really clear description of the methodologies Data Mesh and Data Fabric and how both of these measure up to the tooling made available by Microsoft Fabric.
The slides really helped her to tell a compelling story - a great example of how to use well designed visuals and animations!
She provided a demo to bring Data Mesh to life on Microsoft through features such as Domains and OneLake Data Hub to enable domain ownership and discoverable data product principals that underpin Data Mesh respectively.
Marthe concluded: "Can you implement Data Mesh in Microsoft Fabric? Yes! There are no other tools out there that can help you more."
Analytics Architectures on Microsoft Fabric
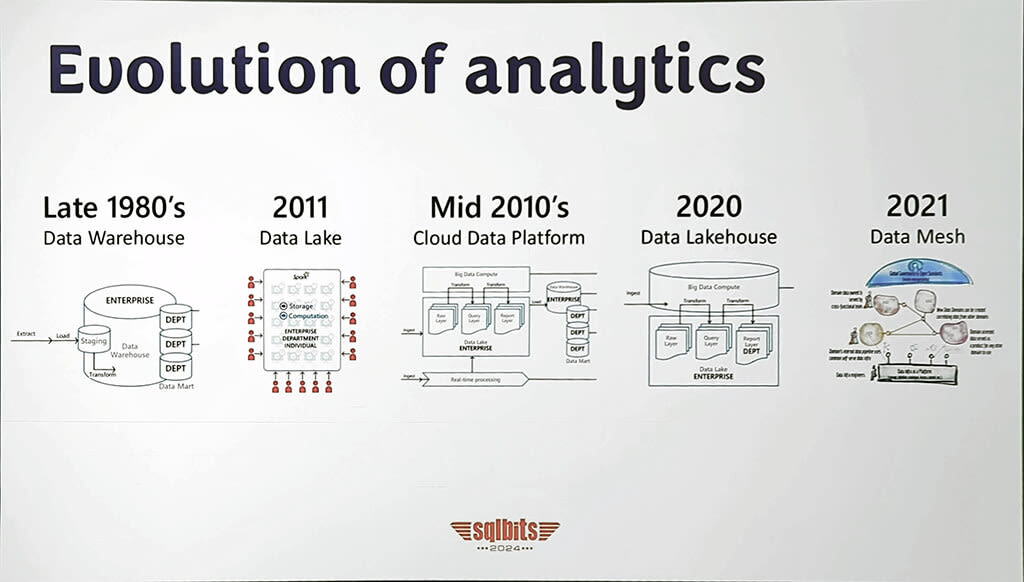
Freddie Santos and Brad Schacht described the evolution of analytics architectures over the last 40 years.
In the 1980's the "monolithic enterprise data warehouse" architecture was characterised by the length of time (many months) they took to implement, that performance tended to degrade over time and the fact that the centralised platform / model / team tended to become a bottleneck to ongoing evolution of user requirements.
They then took us through data lake, cloud native analytics, lakehouse and data mesh architectures. Showing how separating storage from compute has enabled us to deliver architectures that are more scalable, lower cost and more agile.
This view resonated as it is similar to the scene setting we do in our own Data Strategy briefing which is a one hour session that we offer to organisations to help them refine their thinking about cloud native data platform strategies.
Microsoft Fabric enables the latest generation of architecture through features such as:
- Being able to scale up to run concurrent workloads at enterprise scale.
- Innovative bursting and smoothing billing engine to allow organisations to maximise value from the capacity they have purchased.
- OneLake and shortcuts - can be used to break down data silos, make data movement easy whilst preventing copies of data.
- Providing a Lakehouse to better manage tabular data, avoiding a "data swamp" whilst allowing different compute engines to be brought to the data based on different workloads.
- Domains - enabling departments that are handling the data take ownership, and promoting the principal of "data as a product".
Both Brad and Freddie are client facing, so they were able to cite practical examples. I particularly liked their advice that shifting to a modern architecture represents transformation at all levels in an organisation, requiring significant investment to up-skill people and change mindset and behaviours.
Common Data Science Mistakes
Tomaž Kaštrun highlighted some of the common issues that impact data science projects.
The main points that resonated with me:
- Successful data science projects are founded on understanding the business domain and the data.
- Focus on the business goal and not the tooling.
- Create a plan: "if you fail to plan, you plan to fail".
- Manage expectations with stakeholders - be prepared to "fail fast" if the feasibility of project is low.
- Don't over-complicate, don't over-simplify. Find the right balance by building complexity incrementally.
I specifically liked this quote:
"If you can't explain what your model is doing to your 5 year old, it is not production ready."
Govern your data in Fabric
Hylke Peek gave us a tour of the data governance features in Microsoft Fabric.
This spanned features including:
Sensitivity labels - I learned that child artifacts inherit changes to sensitivity labels from their parent artefact, but this is stopped if manual changes are made. Sensitivity are "just a label" they do not currently trigger any functionality. In larger more complex Fabric implementation, Hylke advised programmatic assignment with PowerShell.
Promotion and certification - are interesting features that enable endorse and promote "data products" that they have created on Fabric. Hylke advised that you have to train people to use it in the right way. When you make certified artifacts discoverable, people who do not have access to the workspace and request access to it. One word of caution is that this creates an individual assignment to a workspace, which is not sustainable, better to use security groups.
Lineage - in Fabric, this only provides visibility one step away from workspace, so it is not possible to view the full lineage of more complex processes that span multiple workspaces. Lineage is really useful for impact analysis - if I change this, what will happen? For example when making semantic model changes - which reports could be impacted? It is also possible to notify users of Power BI reports.
Domains - are logical groupings of workspaces. You can assign people to domains with responsibilities such as admin. This helps to devolve governance. You can create a hierarchy through one level of sub-domain. You can also set a default domain, driven by security groups: if you create a workspace, by default it will be created in this domain.
Purview Hub - is embedded in the Fabric user experience. It provides a Power BI report to explore all artifacts that you administer in Microsoft Fabric.
Building a High Performing Impact Centre of Excellence (CoE) in Microsoft Fabric
Vishal Pawar provided an overview of the Microsoft Fabric adoption roadmap that has been developed by Microsoft. This is a really well thought out framework that existed before Fabric as the Power BI adoption roadmap.
It is interesting how the majority of the 12 areas spanned by the adoption framework are concerning cultural and organisational aspects.
Vishal brought this to life by sharing his own experience helping clients to establish Centres of Excellence (CoE).
The key points that I noted were:
Executive sponsorship is key and brings everything together. In his experience, where this isn't in place, it is very difficult to help the organisation to become more data driven.
A "Community of Practice" (CoP) is not the same as a CoE. It exists to give the community a stage to talk about the technology. What works, what doesn't work. Enabling knowledge sharing, boosting adoption.
When I asked "How do tou stop the CoE becoming a bottleneck?", Vishal advised: "The CoE should never stop people from doing things. The CoE is there to enable people, not to put approvals in place that slow people down."
The Critical Role of Creativity in Technical Professions
One of the great things about SQLbits is that it makes space for non-technical sessions. This presentation by Annabel Hemingbrough was short but it packed in a lot in.
Annabel promoted the use of visual stimuli to help with creative thinking and problem solving. One example she gave was searching web sites such as Pinterest on a specific topic for inspiration, then using this to ask questions such as "How does this make you feel?".
She also likes to use mind mapping to simulate creative thinking. It enables rapid capture and organisation of ideas, and the ad hoc layout promotes non-linear thinking. Mind maps can also be built collaboratively by a team. We agree! We make a lot of use of Mural at endjin for collaborative visual thinking.
Next her talk explored the importance of getting visuals right in content such as reports, presentations and documentation. She focused on three areas: colours, fonts and alignment, providing guidance on how to generate content that engages people.
Finally she talked about how she has learned to use ChatGPT to help her reframe content with the right voice. The example she gave was having to make a complaint and using ChatGPT to re-frame her initial draft using language that was more formal.
In conclusion, Annabel made an important point: your technical skills are fundamental to being creative in your specific field or profession. The tools and techniques she covered in her talk should be thought of as an additional layer that complement your technical skills, allowing you be more productive and innovative.
The Party
The party on Friday night was amazing. One of the hanger sized spaces had been set up with an array of entertainment including disco, karaoke area, bucking bronco, bars, multiple food vendors, fairground stalls / games. Lots of props were scattered around to provide photo opportunities. Ed and I grabbed a snap sitting the SQLbits biplane.

There was a Tom Cruise look-alike who had me fooled for a few minutes. He was available for selfies, but also joined the SQLbits team for a performance of "Great Balls of Fire".
Summing up
It was an action packed 5 days. Great sessions, but also many opportunities to meet fellow data professionals and make new connections. With the advent of new products such as Microsoft Fabric, the data and analytics ecosystem is flourishing!
Thanks SQLbits, can't wait for next year!